
WGU Applied Algebra FXO2 PFXP C957 Applied Algebra Exam Questions
Preparing for the Applied Algebra exam is simple with Certs Vault. We offer easy-to-understand study materials that help you learn the most important exam topics. You can study using our PDF questions, practice online with a real exam-style test, or use the desktop practice software. Choose the study method that works best for you and prepare at your own pace.
At Certs Vault, we keep our Applied Algebra practice questions up to date. Whenever the exam syllabus or objectives change, we update our study materials so you always learn the latest topics. This helps you save time, avoid outdated content, and feel more confident when you take your exam.
Question #1 (Topic: demo questions)
Correct Answer: D
Explanation:
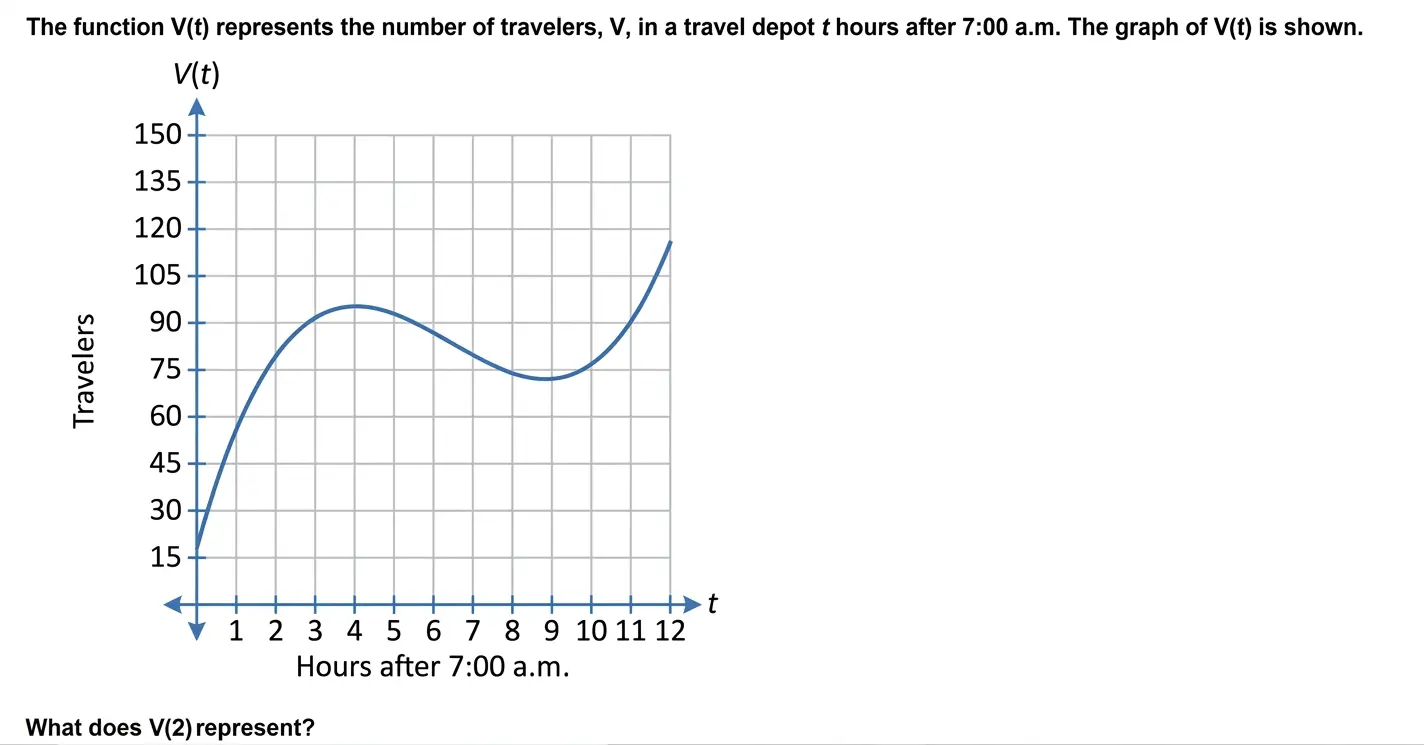
he function V(t)represents the number of travelers in the travel depot.
he function V(t)represents the number of travelers in the travel depot.
The input trepresents:
" hours after 7:00 a.m. "
The output V(t)represents:
" number of travelers "
So V(2)means the number of travelers in the depot:
2 " hours after 7:00 a.m. "
From the graph, when:
t=2
the value of V(t)is approximately:
79.2
Since V(t)measures travelers, not hours, V(2)represents:
79.2 " travelers "
Therefore, the correct answer is:
▭ ( " D " )
Question #2 (Topic: demo questions)
Correct Answer: A
Explanation:
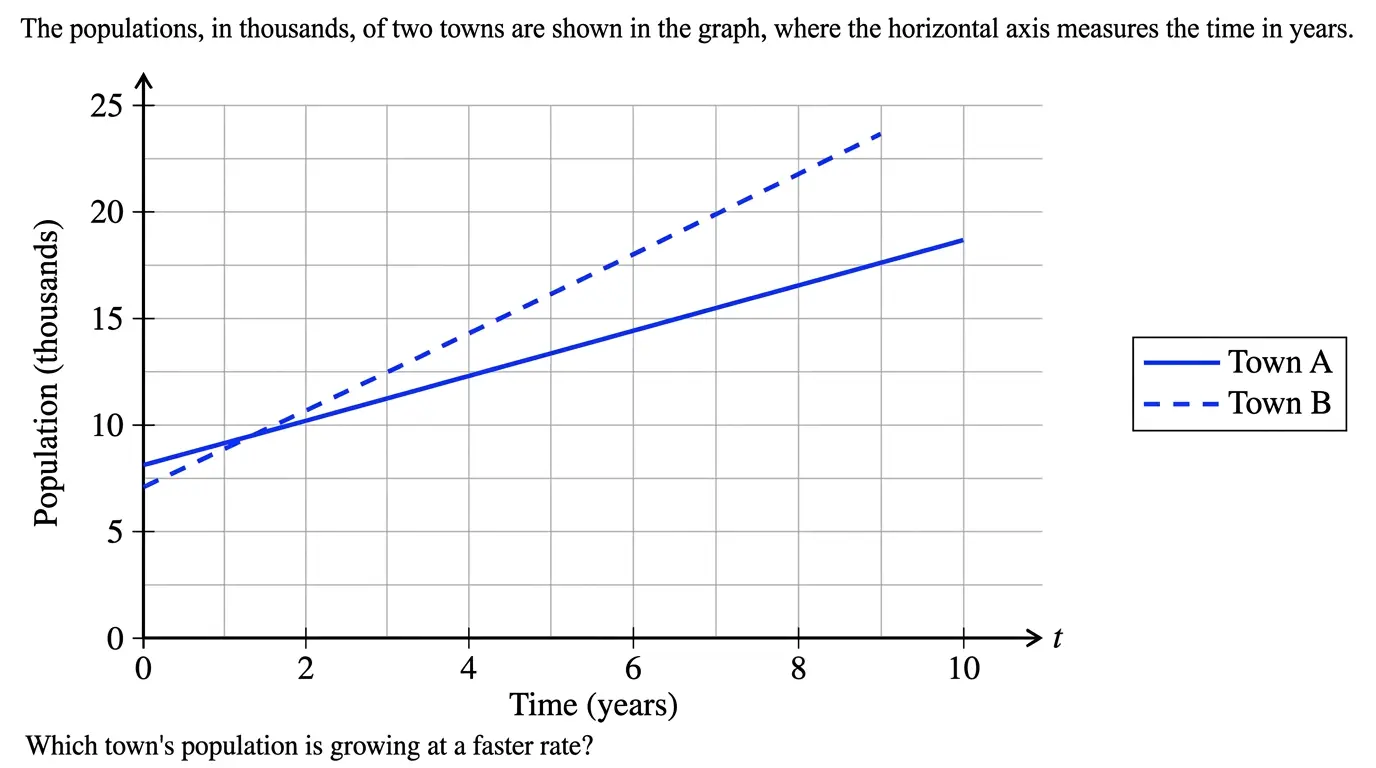
he graph compares the populations of two towns over time.
he graph compares the populations of two towns over time.
The horizontal axis represents:
" Time in years "
The vertical axis represents:
" Population in thousands "
The graph shows:
Town A as the solid blue line.
Town B as the dashed blue line.
To determine which town’s population is growing faster, we compare the slopes of the two lines.
In Applied Algebra, the slope of a line represents the rate of change:
" slope " = " change in population " / " change in time "
From the graph:
" Town A grows at about " 0.9 " thousand people per year "
" Town B grows at about " 1.6 " thousand people per year "
Now compare the growth rates:
1.6 > 0.9
So Town B’s population is growing at a faster rate.
The values 8.0and 6.5describe starting populations, not growth rates. Since the question asks about growing at a faster rate, we must compare the slopes.
Question #3 (Topic: demo questions)
Correct Answer: A
Explanation:
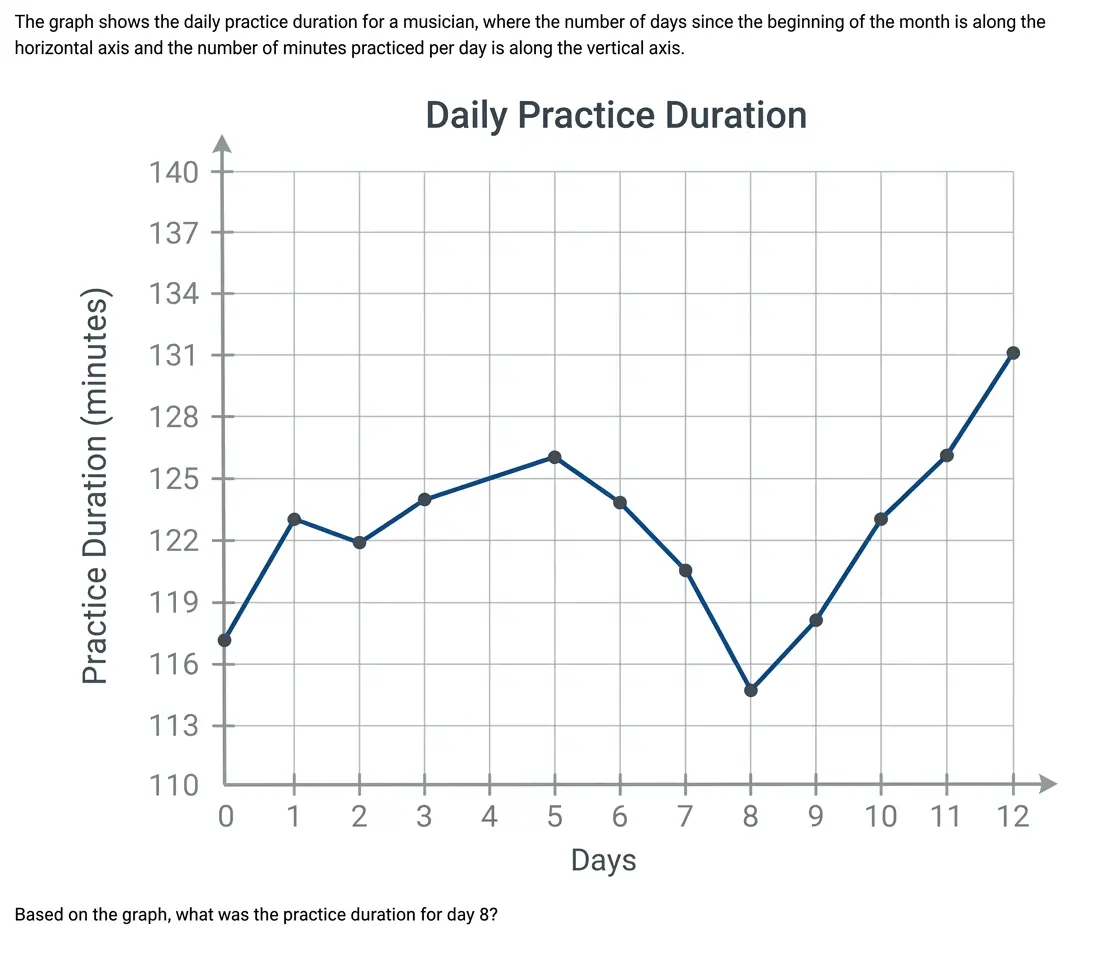
This question asks us to interpret a value from a graph.
This question asks us to interpret a value from a graph.
The horizontal axis represents:
Days
The vertical axis represents:
Practice duration in minutes
We need to find the practice duration on day 8.
To do this:
Locate 8 on the horizontal axis.
Move vertically until you reach the blue graph.
Read the corresponding value on the vertical axis.
From the graph, when:
x=8
the blue graph is at:
y=115
So the musician practiced for:
115 minutes
Question #4 (Topic: demo questions)
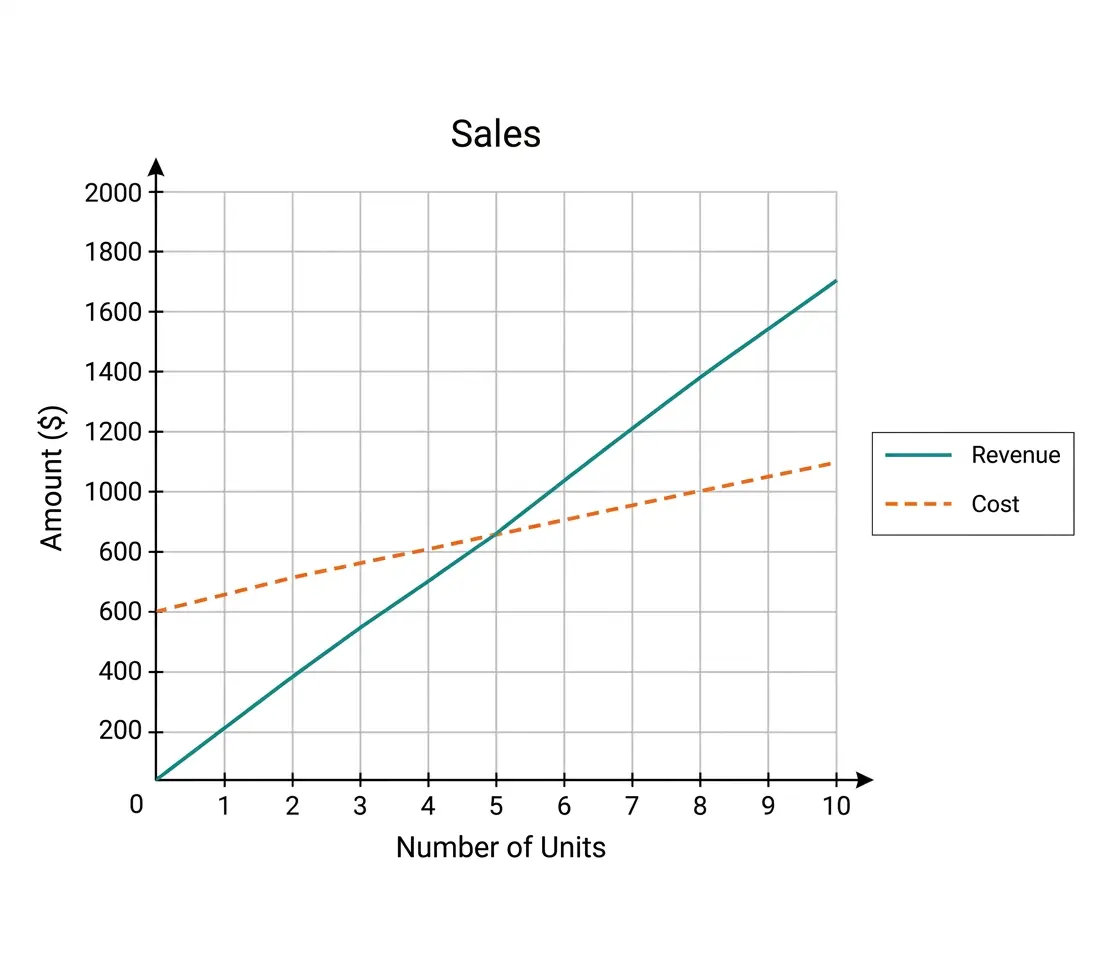
The graph shows the functions that model the cost and revenue. How many down quilts need to sell to break even/start making a profit?
Correct Answer: B
Explanation:
This question asks us to interpret a graph showing cost and revenue. In Applied Algebra, the break-even point is where
This question asks us to interpret a graph showing cost and revenue. In Applied Algebra, the break-even point is where
On a graph, this happens where the revenue line and the cost line intersect. From the graph: The solid blue line represents revenue. The dashed blue line represents cost. The break-even point occurs where these two lines cross. Looking carefully at the graph, the two lines intersect at approximately: The horizontal axis represents the number of units, meaning the number of down quilts sold. So the person needs to sell about: to break even. After selling more than 6 quilts, the revenue line is above the cost line, meaning the person begins making a profit.
Question #5 (Topic: demo questions)
The number of property sales in a region this year is expected to be 6 less than the number of property sales in the region last year. The function represents the number of property sales this year, where represents the number of properties sold last year. Which notation represents the number of property sales this year, given that the number of properties sold last year was 330?
Correct Answer: A
Explanation:
We are told that this year’s number of property sales is 6 less than last year’s number of property sales. Let: and